Running Kubernetes across a fragmented landscape of cloud providers — AWS, GCP, Azure, OTC, and on-premises — introduces challenges that go well beyond basic observability. The real problem is no longer collecting metrics or logs. It’s sovereignty.
Organizations want a unified operational view of their infrastructure, but they must also respect strict data residency and compliance requirements. Logs and metrics are often classified data; in many environments, they are not allowed to leave the cloud or region where they are generated. Solving this tension requires a deliberate architectural approach, not just another monitoring tool.
To address this, monitoring storage must be decoupled from querying. Instead of aggregating all observability data into a single centralized backend, each environment writes metrics and logs to its own dedicated object storage bucket within its respective cloud. The result is clear ownership, strong isolation, and a much simpler compliance story.
The observability stack: From edge to insights
The architecture relies on a cloud-native observability stack designed to operate across multiple regions and providers while preserving strict isolation boundaries.
1. Log management with Loki and Promtail
For logging, we use Loki. Unlike traditional logging systems that index every log line, Loki indexes only metadata (labels). This dramatically reduces storage and compute costs while still allowing fast, targeted queries through Grafana.
At the node level, Promtail acts as the local agent. It tails container logs, enriches them with contextual labels such as namespace, workload, environment, and region, and forwards them to a localized Loki instance. This instance is responsible for writing log chunks directly to the environment’s sovereign object storage, ensuring the raw data never leaves its region of origin.
Keeping log ingestion local has several advantages:
- Efficiency: Minimizes cross-region traffic and egress costs
- Performance: Keeps log latency low for real-time troubleshooting
- Compliance: Ensures sensitive logs remain within their sovereign boundary
2. Scalable metrics with Prometheus and Thanos
Metrics are the backbone of Kubernetes monitoring and are handled primarily by Prometheus. Prometheus excels at scraping time-series data and triggering alerts. However, in a multi-cluster setup, Prometheus alone struggles with long term-retention and global visibility.
This is where Thanos becomes essential. By integrating Thanos, Prometheus gains:
- Centralized querying across multiple clusters
- Long-term retention using environment-local object storage
- High availability, ensuring metrics survive node or cluster failures
Prometheus continues to focus on real time monitoring, while Thanos extends its reach without changing its core operating model.
How sovereign monitoring actually works
To understand why this architecture scales, it helps to follow the data flow. The guiding principle: Storage is decentralized. Queries are centralized.
1. Metrics: The Prometheus-to-Thanos hand off
In a default setup, Prometheus stores metrics on the local disk. This limitation is addressed using Thanos through three key processes:
- The sidecar pattern: A Thanos sidecar runs alongside every Prometheus instance. Prometheus retains recent metrics locally, while the sidecar exposes them for remote querying
- The shipping process: At regular intervals, the sidecar pushes completed TSDB blocks to a dedicated object storage bucket within the same cloud environment and region.
- The query path: When an operator opens a Grafana dashboard, the Thanos querier pulls recent metrics from the Thanos sidecar and historical data from the appropriate object storage bucket. Query results are streamed on demand and are not replicated or persisted outside the originating environment, ensuring sovereignty during query execution
2. Logs: Label-based efficiency with Loki
Loki avoids the expense of traditional indexing by focusing on metadata:
- Promtail as the shipper: Promtail discovers logs, attaches labels (e.g., env=production), and pushes them to Loki
- Minimal indexing: Loki stores compressed log chunks in object storage and indexes only metadata
- Sovereignty by design: Each Loki instance writes to an environment, region, and customer-specific object storage bucket
The architecture of sovereign observability
The overall design follows a hub-and-spoke model.
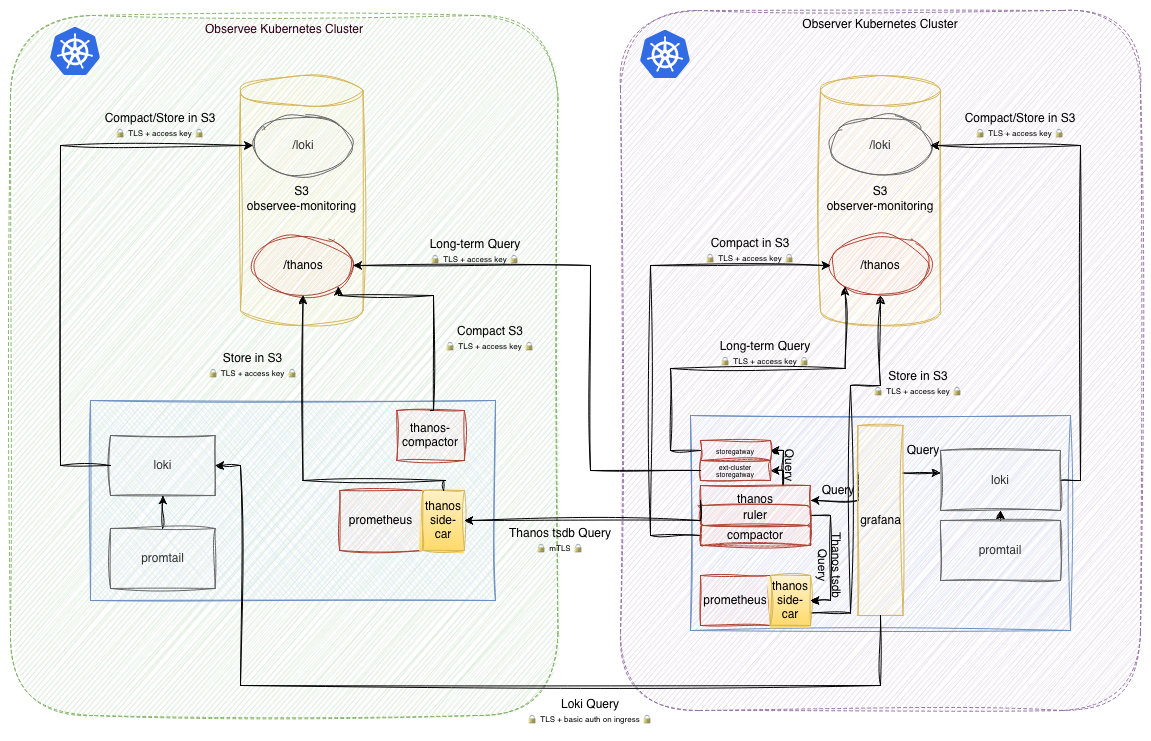
Figure 1. Multiple observee clusters feed data into a central observer cluster (monitoring hub)
1. The localized data plane (observee clusters)
Each production cluster operates a lightweight stack focused on local data collection:
- Metrics scraping: A local Prometheus instance scrapes metrics via a pull model. The Thanos sidecar serves this data to the central observer.
- Log tailing: Promtail tails logs and pushes them to a localized Loki instance, maintaining clear data residency boundaries.
2. Isolated sovereign storage (object storage buckets)
Sovereignty is enforced at the storage layer. Instead of a shared data lake, each environment, region, and customer writes to its own dedicated bucket. Write access is restricted to the originating environment. The Observer Cluster accesses storage using scoped, read-only credentials.
3. Security, hardening, and compliance
All inter-cluster communication is protected using a multi-layered security approach:
- Mutual TLS (mTLS): The Thanos querier communicates with remote Thanos sidecars and store gateways over mTLS-secured gRPC connections, ensuring encrypted communication and mutual authentication
- IP allowlisting: Every observee cluster permits incoming traffic only from the specific static IP addresses of the observer cluster
- Zero-trust logic: By combining mTLS with IP allowlisting, metrics and logs can only be "pulled" by a known, authenticated entity from a trusted network
4. Alerting and global rule evaluation
Sovereign monitoring requires alerts that can span clouds without violating data boundaries:
- Local observee alerts: Triggered directly by local Prometheus and Loki instances using live data to ensure immediate response to cluster-specific issues
- Thanos ruler (Global SLIs): Pre-computes complex, long-term metrics (7/30/90-day SLIs) against the global query API to keep dashboards performant
- Grafana dashboard alerts: Enables UI-driven alerting directly on dashboards for intuitive operational monitoring
- GitOps alert management: All alerting rules are maintained in a central repository, with standardized notification routing
5. The centralized query plane (observer cluster)
The observer cluster provides a unified view of the global infrastructure without owning or persisting the underlying data:
- Global querying: The Thanos querier "pulls" remote metrics on-demand, minimizing cross-cloud data transfer, as data is fetched only when a query is executed rather than being continuously replicated to a central repository
- Grafana (the centralized visualization hub): Users never connect directly to source data. Authentication, authorization, and auditing are enforced centrally. Access is managed through data source permissions, controlling precisely which environments a specific user or team can access
Access control and deployment models
The granularity of access control depends on the specific capabilities and deployment model of each backend component:
- Loki (distributed access): Loki is not centrally deployed. Each cluster operates its own independent Loki instance, protected by cluster-specific basic authentication and restricted by IP allowlisting, ensuring they only accept traffic from the central Grafana. Grafana authenticates separately to each cluster's Loki backend, ensuring access isolation is strictly enforced at the Grafana-Loki boundary
- Thanos query (unified access): Thanos query is integrated into Grafana as a local service data source. While it uses backend-level authentication to communicate with its spokes, Thanos query itself does not natively enforce granular user-level access control
Sources
Metrics (Thanos & Prometheus)
Logs (Loki & Promtail)