Auf der Hannover Messe, einer der weltweit führenden Industriemessen, die vom 31. März bis 4. April stattfand, bot sich in diesem Jahr die ideale Gelegenheit, die Leistungsfähigkeit von T-Systems Motion Data live zu demonstrieren.
Die Veranstaltung diente als reale Testumgebung, in der unsere Lösung Bewegungen von Besucherströmen in Echtzeit erfasste und visualisierte. Von den ersten Vorbereitungen bis zu den besucherstärksten Tagen ermöglichte Motion Data die Analyse der Besucherflüsse auf dem gesamten Messegelände und zeigte eindrucksvoll, welchen Mehrwert ortsbezogene Erkenntnisse in dynamischen, stark frequentierten Situationen bieten.
Was ist Motion Data?
Motion Data ist eine fortschrittliche Geo-Analytics-Lösung, die anonymisierte Signalisierungsdaten aus dem Mobilfunknetz in verwertbare Echtzeit-Einblicke verwandelt. Durch die Analyse aggregierter Standortdaten von Mobilgeräten zeigt Motion Data auf, wie, wann und wo sich Menschen bewegen – ohne dabei personenbezogene Informationen zu erfassen.
Diese datengestützte Lösung ermöglicht es Organisationen:
- Öffentliche Verkehrsmittel zu optimieren, basierend auf tatsächlichen Pendlerströmen
- Einzelhandelsleistungen zu verbessern, durch Einblicke in Kundenfrequenz und Verweildauer
- Großveranstaltungen besser zu planen, durch das Verständnis von Aktivitätszonen und Bewegungsdynamiken
- Gezieltes Marketing zu betreiben, durch die Identifikation von stark frequentierten Bereichen
- Stadtplanung und Smart-City-Initiativen zu unterstützen, mit realen Bewegungsdaten
Darüber hinaus liefert Motion Data Erkenntnisse nahezu in Echtzeit über benutzerfreundliche Dashboards, sodass Unternehmen schnell fundierte Entscheidungen treffen können. Besonders wichtig: Motion Data arbeitet ausschließlich mit anonymisierten Datensätzen und ist vollständig DSGVO-konform.
Echtzeit-Einblicke von der Hannover Messe 2025
Um diese Fähigkeiten greifbar zu machen, wurde Motion Data während der Hannover Messe über öffentliche Dashboards präsentiert. Diese Dashboards boten nahezu in Echtzeit Einblicke in das Besucherverhalten – sie verfolgten Bewegungen zwischen den Hallen, identifizierten Stoßzeiten und zeigten Trends über die verschiedenen Messetage hinweg.
Woche der Veranstaltungsvorbereitung (vor dem 30. März)
In den Tagen vor der offiziellen Eröffnung waren bereits rund 5.000 Personen auf dem Gelände aktiv. Es ist davon auszugehen, dass es sich dabei um Logistikteams, Dienstleister und frühe Aussteller handelte, die die Messe vorbereiteten.
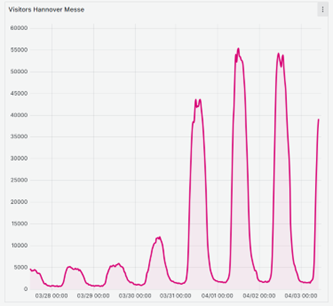
Bild 1. Besucher auf der Hannover Messe vom 28. März bis 3. April – frühe Aufbauphase vor der offiziellen Eröffnung
30. März (Eröffnungsabend)
Die Messe begann offiziell am 30. März mit einem Eröffnungsabend, der rund 12.000 Besucher anzog – ein deutlicher Anstieg im Vergleich zur Vorwoche.
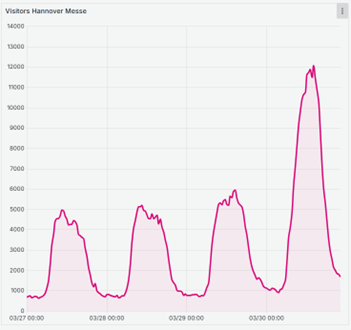
Bild 2. Stetiges Besucherwachstum mit starkem Auftakt am 30. März
1. April (Besucherhöchsttag)
Der 1. April war der besucherstärkste Tag der Veranstaltung mit über 55.000 Besuchern – 10.000 mehr als am 31. März. Während die meisten Teilnehmer das Gelände bis 17:30 Uhr verlassen hatten, blieben rund 4.000 Besucher in den Hallen 8 und 9 bis in den Abend hinein. Im Vergleich zu anderen Tagen, an denen die Besucherströme früher abnahmen, lässt sich vermuten, dass vor Ort eine Abendveranstaltung stattfand, die den Aufenthalt verlängerte.
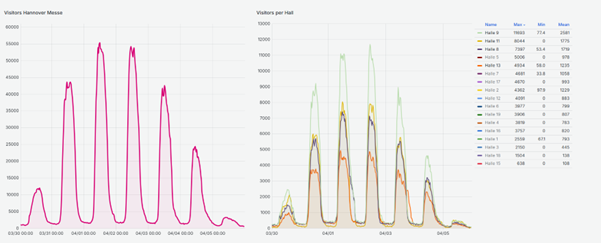
Bild 3. Besucherhöchstwerte am 1. April mit detaillierter Aufschlüsselung pro Ausstellungshalle
Herkunft der Besucher: Woher kamen die Teilnehmer?
Zusätzlich zur Echtzeitverfolgung von Bewegungsmustern lieferte Motion Data spannende Einblicke in die geografische Herkunft der Besucher der Hannover Messe. Durch die Analyse anonymisierter Netzdaten konnte nachvollzogen werden, aus welchen Regionen und Städten die meisten Besucher stammten.
Top vertretene deutsche Regionen:
- Der eindeutige Hotspot war das zentrale Niedersachsen, insbesondere die Region Hannover selbst.
- Auch die Metropolregion Hamburg und die Hauptstadtregion Berlin trugen erheblich zur Gesamtbesucherzahl bei.
- Weitere starke Präsenz kam aus dem Weserbergland und dem südlichen Niedersachsen.
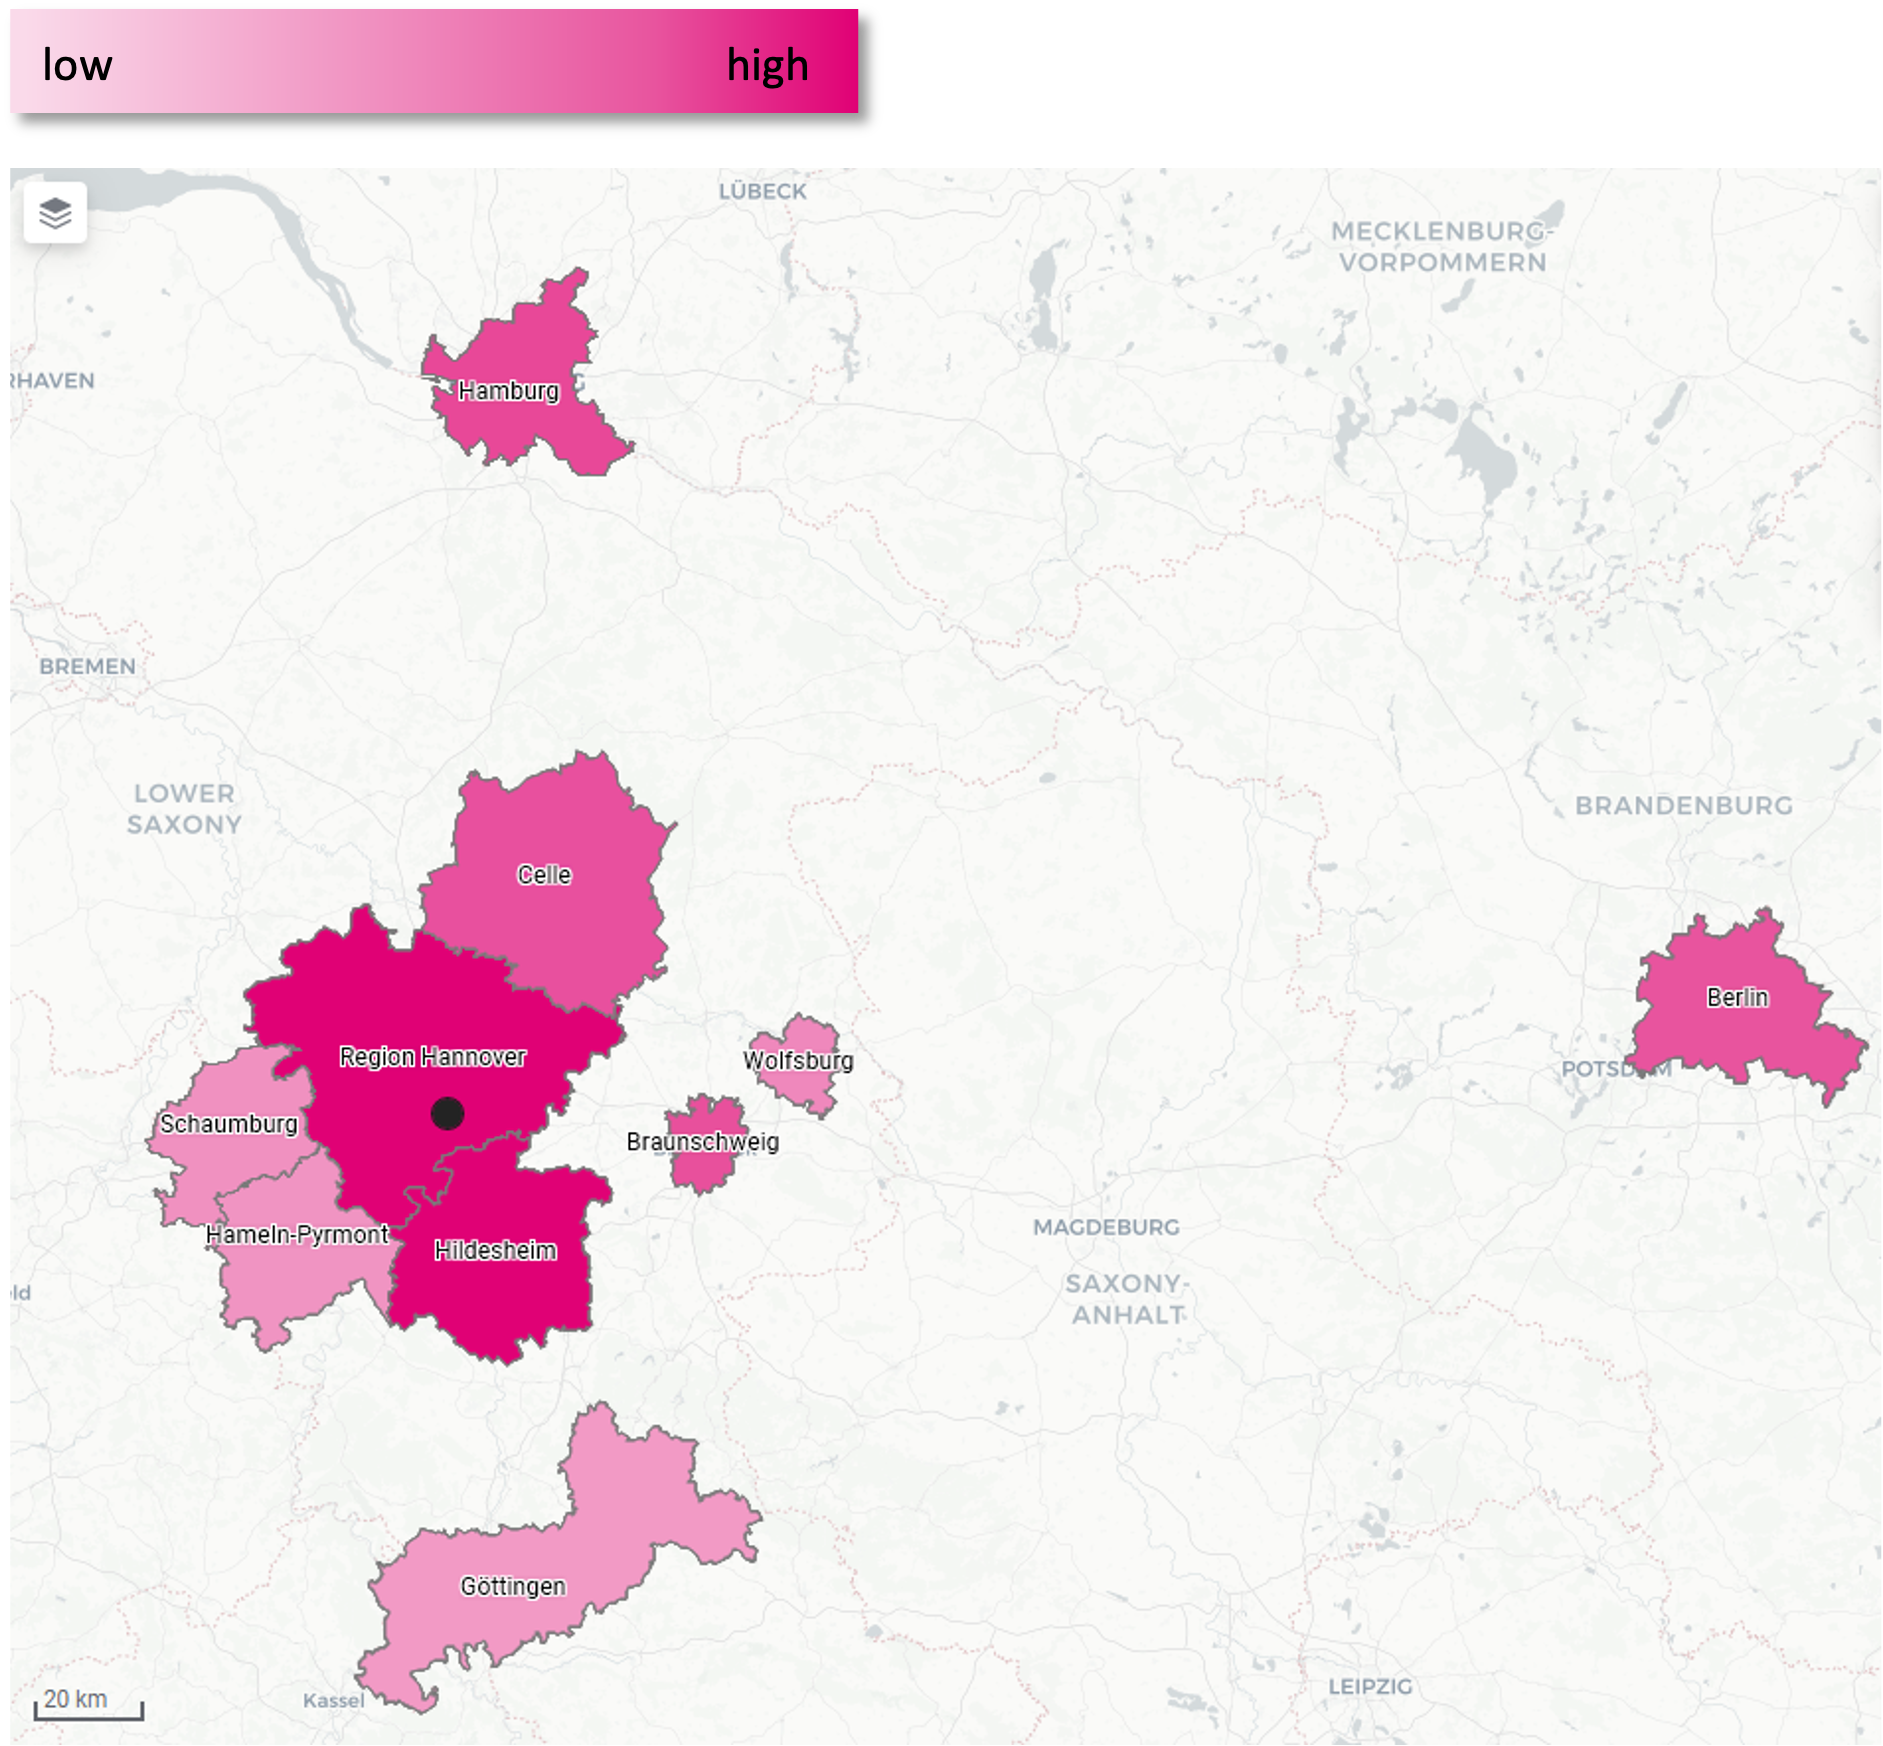
Bild 4. Heatmap der regionalen Besucherherkunft innerhalb Deutschlands
Internationale Präsenz: Ein weltweites Publikum am 1. April
Der 1. April war nicht nur der besucherstärkste Tag, sondern zeichnete sich auch durch die größte internationale Beteiligung aus.
Wichtige Erkenntnisse:
- Der 1. und 2. April zogen die meisten internationalen Besucher an – vermutlich aufgrund hochkarätiger Programmpunkte und thematischer Highlights an diesen Tagen.
- China stellte den größten Anteil internationaler Gäste, gefolgt von mehreren weiteren Ländern aus Asien und Europa.
- Die Top 10 Herkunftsländer dieser Tage unterstreichen die globale Anziehungskraft der Hannover Messe und liefern wertvolle Impulse für internationale Partnerschaften und Engagementstrategien.
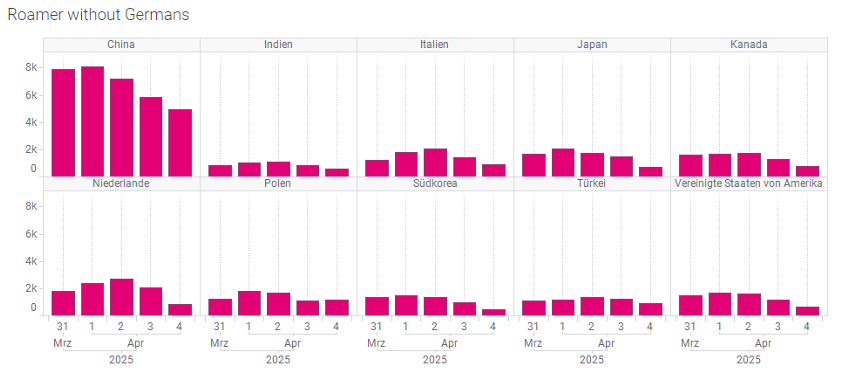
Bild 5. Internationale Besucherherkunft nach Ländern
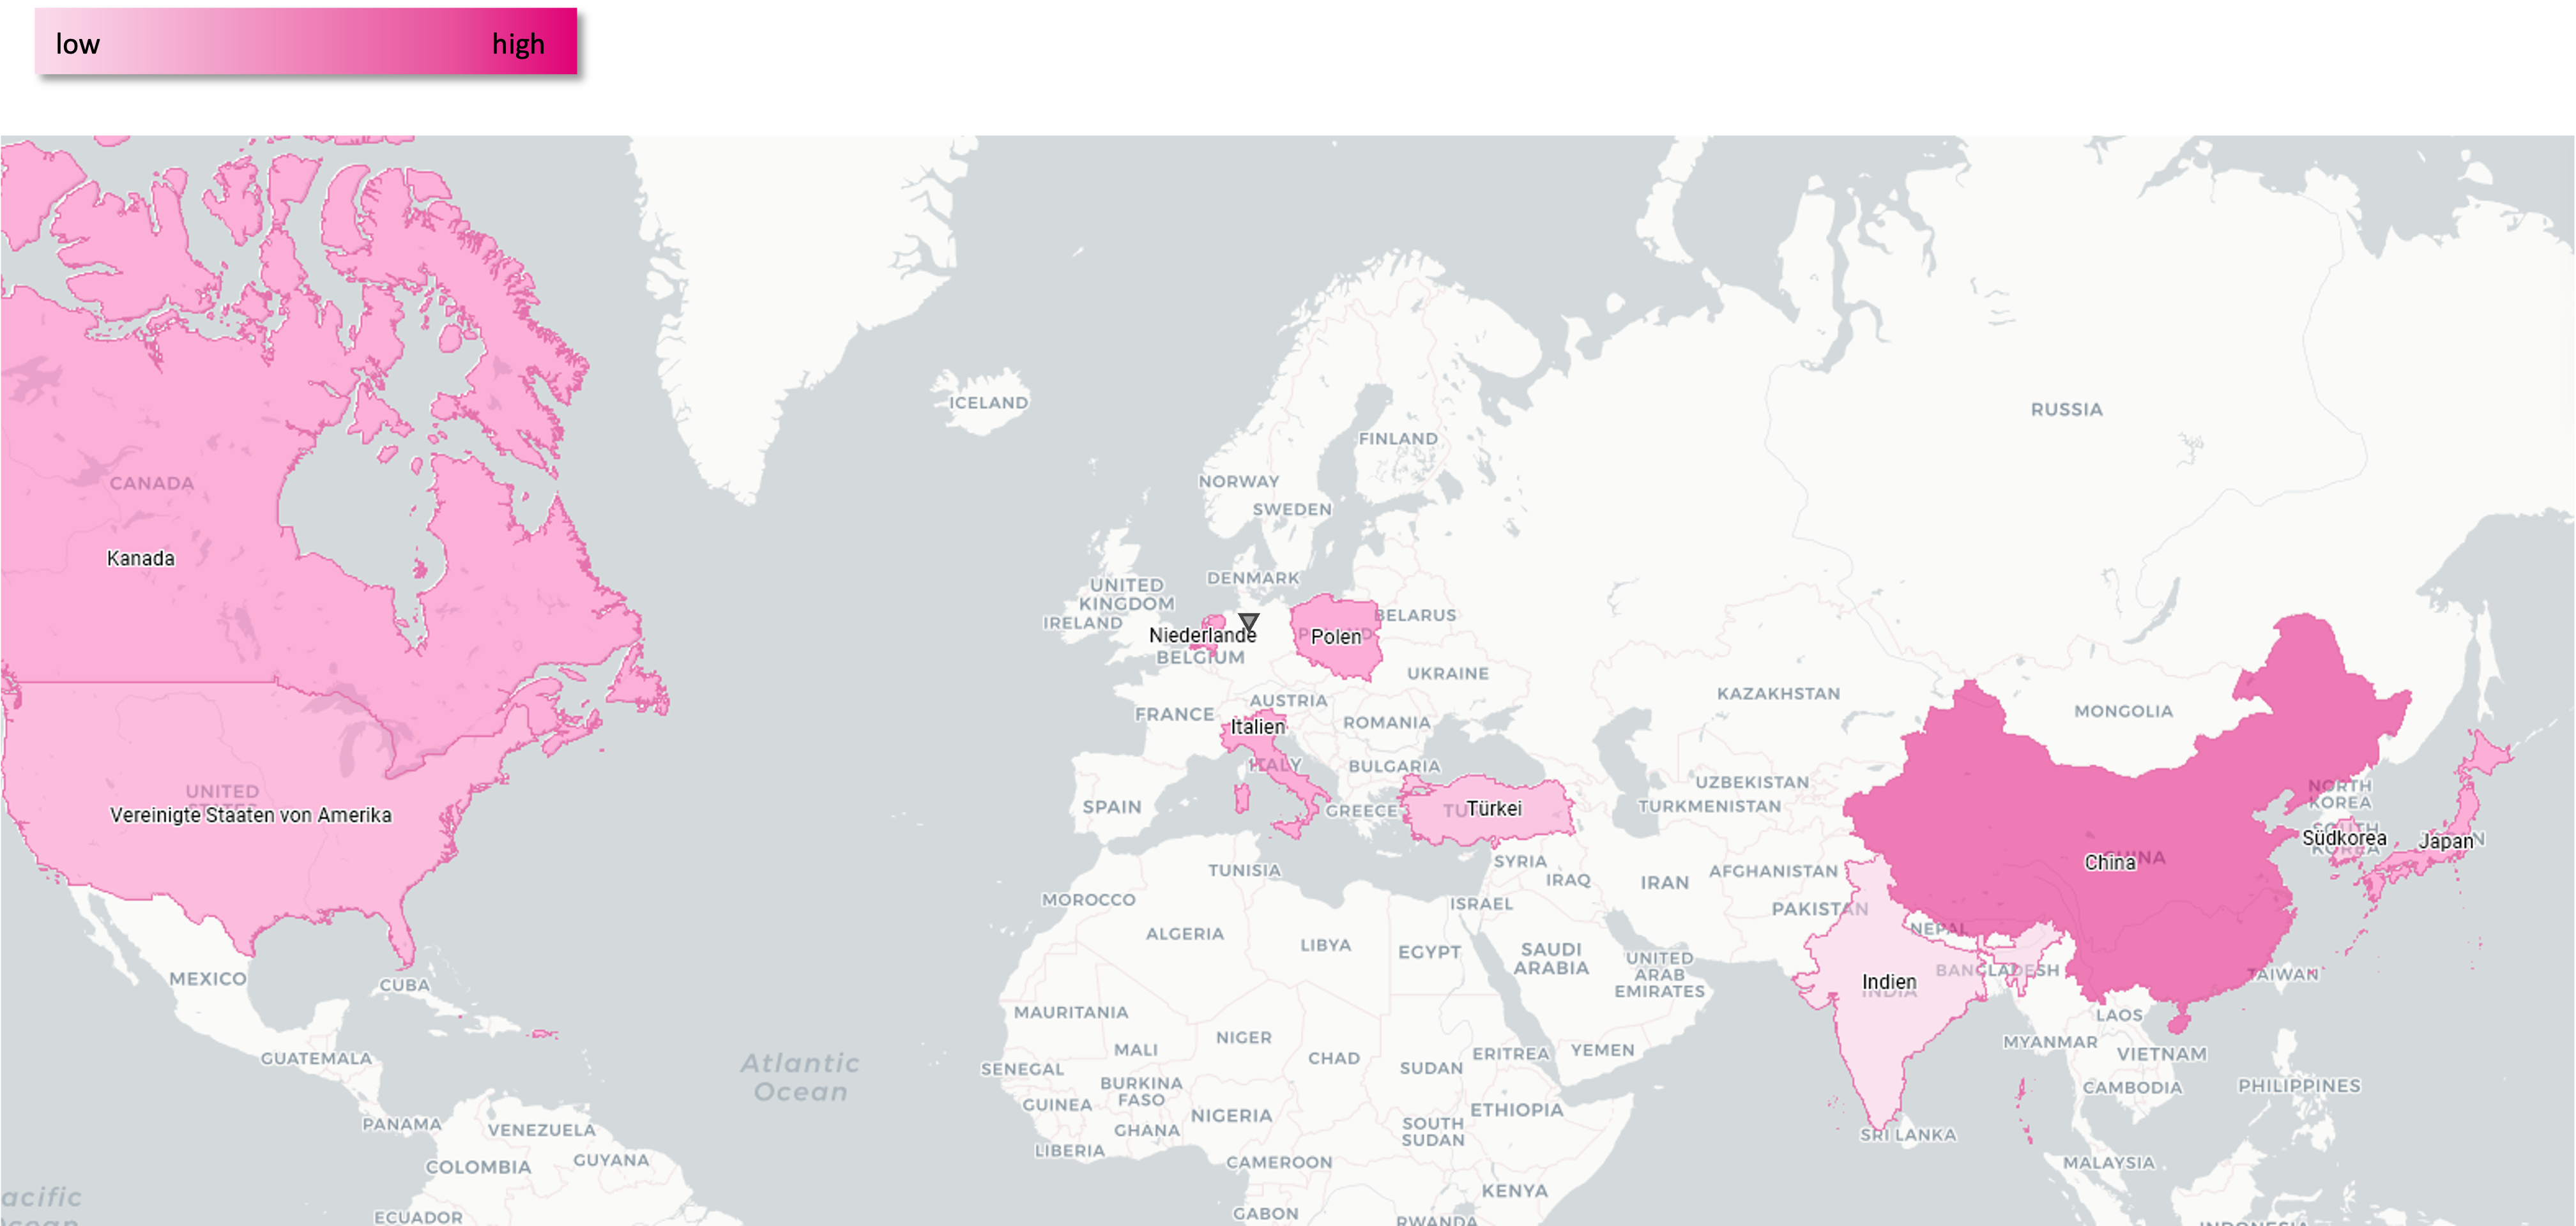
Bild 6. Globale Verteilung der Besucher
Warum Datenanalysen für Unternehmen entscheidend sind
Das Verständnis darüber, wie sich Menschen in Echtzeit bewegen, bietet Unternehmen und Organisationen einen enormen Mehrwert. Von betrieblicher Effizienz und Personalplanung über Marketing, Flächengestaltung bis hin zur Veranstaltungsplanung – Motion Data verwandelt Besucherdynamiken in umsetzbare Strategien.
Diese Erkenntnisse helfen auch Veranstaltern und lokalen Akteuren, besser zu verstehen, welche Regionen besonders aktiv sind, und liefern wertvolle Impulse für zukünftige Kommunikationsmaßnahmen und Investitionen in Infrastruktur. Für globale Marken und Eventplaner eröffnet Motion Data eine neue Ebene der Transparenz im Hinblick auf das Verhalten von Zielgruppen – und unterstützt so intelligentere Entscheidungen und skalierbares Wachstum.
Jetzt datenbasierte Entscheidungen mit Motion Data treffen
Motion Data unterstützt bereits Unternehmen verschiedenster Branchen dabei, komplexe Mobilitätsdaten in strategische Vorteile zu verwandeln. Entdecken Sie noch heute, wie Ihre Organisation von Erkenntnissen über Massenbewegungen profitieren kann!